Piping Vibration Fatigue Risk Assessment
Vibration is not really what we want to thoroughly assess piping vibration risk –we should instead use mechanical stress range and load cycles to estimate the risk for vibration fatigue.
There is an established methodology where mechanical stress range is assessed with respect to fatigue risk with the help of so called SN-data, where S signifies Stress range (Pk-Pk) and N is the Number of load cycles. A combination of stress ranges and load cycles can be added together using Miner’s rule to assess fatigue risk and estimate a pipe’s lifetime. Link
Given this, why do we measure vibration?
The answer is because:
- An accurate measurement of mechanical stress is cumbersome.
- It is relatively easy to measure vibration.
- Vibration, in some situations, is proportional to mechanical stress.
An accurate mechanical stress measurement is cumbersome because:
- A strain gauge that is placed over a stressed area averages the stress. Imagine a position with a hot spot stress and an adjacent area with much lower stress. Mounting a stress gauge across this hot spot stress value will result in a lower stress value than the hot spot stress value alone.
- The location of hot spots is difficult to predict with accuracy.
- The higher the frequency, the smaller the stress range. Strain measurement has a poor signal to noise ratio.
We know that stress is proportional to displacement at static conditions and, hence, is also described by displacement at quasi-static conditions, i.e. at frequencies below 1/3 of the first resonance frequency.
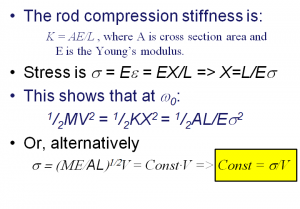
A short derivation of why vibration can be related to mechanical stress is given in Figure 1 for the case of resonant vibration.
Figure 1. Mechanical stress is proportional to vibration velocity at resonance. In essence, this is because potential energy and kinetic energy are equal at resonance. This being so is well known, e.g. for the simple swing where potential energy (height) is zero where kinetic energy (velocity) is maximum and vice versa. (Click on the figure to enlarge)
Please note that the phrases displacement and velocity used here mean relative displacement and relative velocity, as only a relative motion is proportional to strain.
Vibration amplitude is usually highest at resonance. Such loading is dangerous for two reasons:
- The highest dynamic stress tends to occur at resonance.
- Resonance usually appears at ‘high’ frequency and, thus, involves many load cycles per second.
Resonance at f Hz involves f load cycles per second, i.e. 24*3660*f load cycles per day. For example, 100 Hz implies 100 load cycles per second, 360,000 load cycles per hour, and 8,640,000 load cycles per day. Note that most SN-curves cover a range of up to 1E8 load cycles. At 100 Hz, 1E8 load cycles are completed in 11.6 days of continuous operation.
As background information, Gaberson and Chalmers [1] and F.V. Hunt [2] discovered in the 1960s that there is a relation between the vibration velocity and the average mechanical stress per mode (natural frequency) for any linear structure. However, spatially averaged mechanical stress is not very useful, as the highest stress is what poses the highest fatigue risk. The modal susceptibility method developed by E.E. Ungar [3] finds a conservative estimate of peak stress and relates it to measured vibration velocity.
Mechanical stress is proportional to vibration displacement at low frequency, i.e. up to 1/3 of the system’s first natural frequency. At high frequency, acceleration becomes proportional to load (using Newton’s 2nd law of motion). This load may or may not be related to fatigue risk. An explanation for this can be found here: sdof
The part of piping that is usually the first to break from vibration fatigue is small bore (aka appurtenance). This topic is further discussed here: Link
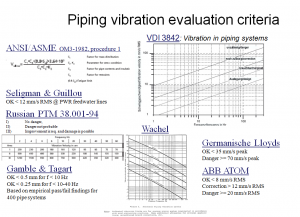
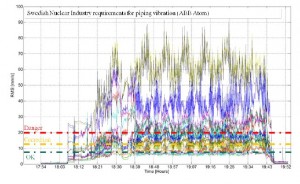
There are a number of vibration risk assessment criteria. Some of these are shown in Figure 2.
Figure 2. A collection of vibration risk evaluation criteria for piping. (Click on the figure to enlarge)
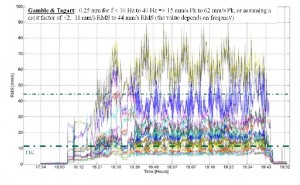
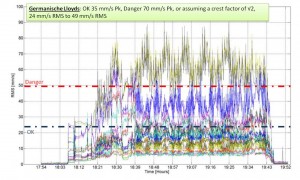
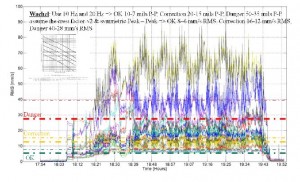
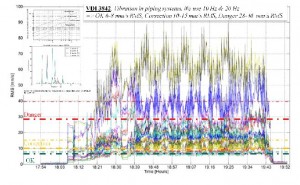
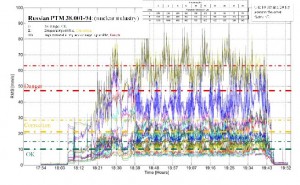
As can readily be seen from the above, risk conditions differ in value and definition. An explanation as to why these criteria differ stems from the fact that we work the problem backwards from stress to vibration when defining such risk criteria. Figure 3 shows example vibration data and how the criteria of Figure 2 would apply.
Figure 3. Piping risk assessment using the criteria of Figure 2 and assumptions that must be applied. (Click on the figure to enlarge)
We see from the curves in Figure 3 that there is a % difference between the vibration risk criteria. Consequently, this % difference results in a smaller difference in vibration amplitude for OK/safe limits and a larger difference in danger limits.
Why do these differences in risk values happen? To explain, we need to analyse how they are derived.
- We assign a stress range value as being acceptable or dangerous. In doing so, we usually ignore the number of fatigue cycles and simply pick a stress range that is sufficiently low to allow for long term operation.
- We may also use assumptions regarding stress concentration factors to determine the allowable stress range.
- Then we will be ready to identify the relation between mechanical stress and a pipe system.
- Pipe systems come in all sizes and configurations. We must therefore assess a large number of dimensions and configurations to identify any rules regarding vibration risk.
In short, the above describes the SN-curve based methodology for fatigue analysis that was mentioned at the beginning of this page.
As different authors have worked the problem backwards using slightly different data and assumptions, it is only natural that different risk limits are returned by the procedure. We see in Figure 2 that there are criteria that use different amplitude definitions, e.g. Root Mean Square (RMS), Peak (Pk) and Pk-to-Pk, as well as vibration displacement, velocity and acceleration.
For harmonic vibration, 2*Pk usually is Pk-Pk. For sinusoidal vibration, the crest factor is sqrt(2) = Pk/RMS, i.e. RMS = Pk/sqrt(2) = Pk-Pk/(2*sqrt(2)). However, the crest factor is rarely used in the general case and mixing harmonic components of equal strengths can yield a crest factor of 2. In practice, crest factors of 3-4 are not uncommon, particularly when there is a malfunctioning machine or process involved.
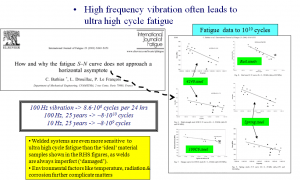
Differences in analysis may also be the result of differences in the material data we rely on. SN-curves are derived using test machines that load cycle material pieces. Fatigue test machines can only run at a certain speed, which is why material data usually is limited to 1E8 load cycles or fewer. Newer types of fatigue test machines can cycle load faster and, thus, can run a larger number of fatigue cycles within a reasonably long test time. New SN data that reaches 1E9 or even 1E10 load cycles is starting to become available.
Only a few years ago, it was assumed that beyond 1E8 load cycles there was a fatigue limit, i.e. that below the end point of the SN-curve there was no reason to worry. Recent data shows that the SN-curve falls and/or breaks off at a different slope as other damage mechanisms come into play (see Figure 4).
This recent hypothesis is on the cutting edge of fatigue research. Little definite knowledge is available, but a fatigue limit appears to be plausible only for a limited number of materials. That said, as long as a material, even one with a fatigue limit, has been worked on, i.e. been machined, threaded or, welded, there will be damage (micro-cracks) and it will not be useful to assume a fatigue limit.
Figure 4. SN curve for up to N = 1E10 load cycles. (Click on the figure to enlarge)
To summarise, we observe that:
- The highest vibration amplitudes tend to appear at resonance and these tend to involve the highest number of load cycles.
- The mechanical stress to vibration relation is not obvious at frequencies that are not resonance frequencies.
- We can relate mechanical stress to vibration velocity (RMS, Peak or Peak-to-Peak).
- Criteria that use vibration displacement either applies at quasi-static conditions (up to 1/3 of the first natural frequency) or tacitly assumes that the system has a typical natural frequency.
- Criteria that use vibration acceleration are based on some assumptions regarding load.
- RMS is proportional to signal energy and is evaluated using an integration time that rarely is defined within the criteria. The standardised RMS integration times that can be found on instruments are: Slow (1 s), Fast (125 ms) and Impulse (35 ms). The RMS value will change depending on the integrations setting. Note that these integration times are defined with respect to human hearing and imposed by what instrumentation hardware is available. Therefore, they are poorly adapted to assess piping vibration risk. As a rule, the shorter the integration time, the closer the RMS value is to the peak value.
- Peak values can be found momentarily or over an extended period of time using a Peak Hold function. The peak value is more conservative, as it finds the highest load, but this load may be present only for a short time and.the peak value may be due to a low number of fatigue cycles.
- Peak-to-Peak (Pk-Pk, Pk-to-Pk) is a more correct assessment of mechanical stress, as it also evaluates the effect of quasi-static loading. However, this is not true when vibration is considered, for the simple reason that a single vibration type (displacement, velocity or acceleration) is not proportional to mechanical stress both at quasi-static and resonant conditions.
- A single number (RMS, Pk or Pk-Pk) assigns the same risk irrespective of frequency, i.e. we disregard the number of load cycles.
- Piping vibration risk assessment disregards the exposure time and assumes that the vibration amplitude is constant.
- Industry-sized piping tends to have its first natural frequency in the range of 5 Hz to 15 Hz. We find that most criteria assume a resonance frequency in this range.
- Fatigue risk is evaluated using SN-curves with up to 1E8 load cycles. That said, limits have been empirically proven.
- All piping vibration risk criteria assume perfect beam behaviour, i.e. that the pipe cross-section is rigid. This is not the case at higher frequencies where the pipe wall starts to deform.
- The piping vibration criteria apply for the main pipe body only – not for small bore or appurtenance.
- Piping vibration risk criteria do not apply to general structural details, as they are not evaluated for such constructions. Similarly, structural vibration risk criteria do not apply to piping.
In short, vibration-based risk assessment very much is based on generic information, i.e. it makes a set of assumptions that can be more or less adapted to your particular situation.
Regarding the practical use of generic data: imagine applying your country’s average salary, car, living standard, holiday patterns, food habits, shoe/clothes size, etc. to yourself and you can imagine how good a fit generic stress data is for a particular situation.
What usually saves the situation is that SN-curves are derived as the average fit for a set of test pieces. The SN curve is thereafter offset by 2*sigma, to match the 10% percentile. On top of this, stress concentration factors and a high value for the number of load cycles is assumed, meaning that a degree of conservatism and statistics is involved.
Can we do better? Yes, we can, but it involves more analysis, as we must work the entire fatigue estimation procedure from stress range to vibration for each particular case.
Often, there is a simulation model available or a simulation model can be set up. This simulation model can be used to compute the relation between mechanical stress and vibration velocity. In doing so, it should be recognised that piping is an ‘imprecise’ type of structure, as pipe supports may be loaded at one point, but not at another. In short, when working the numbers backwards, it is prudent to run the model many times using different assumptions.
Next, we find one mechanical stress to vibration velocity relation per pipe system mode. We can then assess this relationship mode by mode and use the most conservative estimate if we cannot pinpoint exactly which mode may vibrate.
This procedure is better, as it is less generic. But please keep in mind that it still uses many assumptions that we must be able to justify.
References


