Measurement Tools from diy to pro
In short, as a first stab - try to get something - it usually is much better than nothing.
That said, as you know that you are improvising - do not spend too much resource on doing so and keep in mind that what you are doing may be wrong or obscure important parts of the problem.
As food for thought:
- Read the other sections to better understand what you are not doing when using Layman's tools.
- See the Layman's section & if you have the means available - give it a try.
- If the problem is straightforward, perhaps you find what you seek.
- If not, you can at least use what you have wheen seeking professional help.
Keep in mind that what you do, you do at your own risk, e.g. you may damage your smartphone as it was built for low vibration while you may be exposing it to much higher loads.
That said, we have in some cases been able to support customers using Layman's measurement.
Make sure the vibrating object will not hurt you if your touch it.
Press your finger nail to the vibrating object. If the finger cannot stay on the surface, vibration usually is higher than 5 g and things then tend to break.
If it is low frequency vibration, i.e. vibration that you can see with your eyes (the human eye can see vibration up to ~30 Hz).
- Tape or glue a ruler to your vibrating object. You can download also these scales and print them out for attching them to the vibrating object. CmMmScale
- Make sure that major division scale is 10 mm when printing out.
- Attach a wire to the immobile side and arrange it to cast its shadow across the ruler.
- You can now read displacement - better still, you can video record it and compare data between situations. As long as the wire casting the shadow if fix, camera shaking only blurs the picture and does not affect the position reading.
- If you film from a distance and your camera truly is non-moving, you can locate scales at the edges such that scale slides in/out of the frame to give you a reding on motion amplitude. As long as your video is high resolution, you can zoom in and read scale at playback on a larger screen.
As a coarse rule of thumb, for low frequency vibration, say 5 Hz and less, what you see typically is overrated by a factor 10. To the best of our understanding, this overrating results from the human eye's ability to track movement by rolling the eye ball. This implies that the image size matters when playing video on the problem back. In short - do not trust eye sight alone.
This is why you should introduce a known scale into your videos and read the above listed advice on references for these scale readings.
When recording data, note that:
- Wav format is preferred as it is digitized data as-is.
Recording formats using compression algorithms, e.g. MP3, MP4, MPEG, remove data to make the compression. This may render the data unusable for further analysis.
If vibration is higher frequency than what is supported by simpler means, things are a bit trickier.
- If you have a smart phone, try and use its built in accelerometer.
- To do this, download an app - search for Seismometer or Vibration.
- Here is one Android app that can record vibration data: Link
- Remember that your smartphone contains a triaxial (XYZ) accelerometer and that you must keep track of its orientation.
- Press the phone to the vibrating object and record data.
- To make sure that data is meaningful, press a hard edge of the phone to the object different ways. Try also to make sure it stays in contact by adding a thin layer of soft filler between the vibrating object and the phone. If at room temperature, wax is a good choice for filler material. If not, adapt to suit, but remember to keep the layer thin and select something that makes the phone stick to the surface.
- The phone weight, its cover's and PCBs flexibility and the vibration of your problem source decides what you get.
- The phone is made for talking. Therefore, you get what you get. Do not expect high quality at higher frequency.
If it is a noise that is disturbing.
Use your cell phone, laptop or a video camera with built in microphone to record the noise.
- Try to store the sound as a wav file.
- If your phone is a smartphone, you can down load apps that provide time, spectral and spectrogram (time-frequency-amplitude) data. There exist are apps that are Sound Level Meters.
- For PCs, analysis freeware if the more scarce, but you can always record data to wav file and mail it to someone with better resource for analysis.
- Here is a freeware tool for signal analysis on PCs. http://www.sillanumsoft.org
- Before or after the recording, record also yourself talking at normal voice strength in an office environment.
- This is a pretty coarse approach, but normal speech usually is about 55 dB re 20 microPa and a normal voice level from one or more persons can at least provide a ball park estimate on the sound strength. It can serve also as a test case for your smartphone.
- Even better, try to get a cheap sound level recorder from a local multi-store/mall. It will not suffice for legal requirements, but it will be reasonably well calibrated where the phone and videocamera is not calibrated.
- Use the sound level meter together with the cell phone and record the sound strength (you can state the strength at the end of a recording).
Simply put, the system is designed for the purpose of making measurement where the Layman's tool was intended for another purpose and just happens to be usable also for some type of data registration. In other words, you get what you get.
A core difference is that a professional tool is function tested, come with traceable Engineering Unit/Volt and often with built in sensor conditioning electronics. In other words, professional tools come with specifed- and higher- performance.
A measurement system takes in a signal, digitizes it and stores it. Some systems store time data, while other process the signal to reduce data and saves spectral data, and/or level data.
The measurement system can digitize signals from a single or N-channels. Such digitizing can be made :
- Asynchronously for one channel at the time, as is the case for so called Data Loggers.
- In synch for all channels at the same time, as is the case for so called Real Time Systems.
Whether to use few- or many-measurement channels depends both on the problem nature, accessibility and risk.
You need a real time approach when a problem is transient, non repetitive and/or non-linear. The number of channels to apply depends on your budget and what resources you are able to find.
When access is easy, you can always return tomorrow for a new test. When access is poor, you need to prepare as best you can and apply as much resource as sensible.
If risk is high, you need to pull out all stops and really do the best you can to avoid overlooking something. This imples use of many channels, as wide a set of instrumentation as possible - as, truly, you do not know exactly which risk you are minimizing. Widening your instrumentation, therefore, is akin to securing more viewpoints. You mimimize risk by requiring more things than one to add up.
At Qring, we have applied this wide instrumentation principle to projects where we have added a few extra sensor types, on the ground that channels/sensors were available, and the addition of a few extra sensors did not cost much. In the aftermath, it turned out that these extra sensors did add crucial problem understanding and provide a hint to a not-priorly-known type of problem countermeasure.
You may think that we simply got lucky? Then again, "Luck = Preparation + Opportunity" (Seneca)
A channel can serve as reference such that data from several measurements can be combined. A key assumption when combining measurements is that the system is time invariant and linear, i.e. that it does not matter when and in what order a measurement is made.
- A simple example where this assumption does not hold would be an explosion where one would expect different readings at positions A and B before, during and possibly after the explosion.
- An example where the assumption often holds is a rotating machine at steady RPM as rotation and repetitive action across rotations often is deeply embedded into its core functionality.
A phase reference measurement requires two inputs, i.e. two or more channels must be used. The simplest reference is a digital tacho pulse. Other references can be time signals.
Example Reference signals:
- A position on a rotating shaft (a.k.a phasor).
- An accelerometer places at a fixed position on the vibrating object.
- A force instrumented impulse hammer.
- A vibration shaker or loudspeaker input voltage signal.
To use an analogy of a man with a video camera who is walking around a crowd trying to document where people are. In the asynchronous mode, he would turn the camera on/off and point it in different directions to document part of the crowd and assume this should suffice. This assumption likely is motivated if he is filming a seated audience watching a show and less motivated, say, documenting the positions of a basket ball team while in game. If the video man does not watch out, he may get tricked from people leaving the scene, e.g. during a break.
Similarly, the reference assumption would be that the video camera guy tracks the camera position and orientation such that he can identify the position of each person he was filming. Again, this is a probable assumption for the seated audience and less so for the basket ball team. A multichannel real time data acquisition would be analogous to the camera capturing the whole audience/team from a single view. A multichannel asynchronous data acquisition would be analogous to the camera capturing the whole audience/team from a single view with the camera taking pixel readings at different positions at different times. The asynchronous approach works if the pixel-to-pixel delay is sufficiently small.
Pressure
Pressure is comprised of three components:
- Line Pressure (LP) - static, non propagating, pressure
- Kinetic Pressure (KP) - 'vind' pressure that moves with the flow velocity
- Pulsation - 'sound' that propagates as waves with the wave speed.
A pressure sensor can react to all three components and it is up to the analyst to make sense of what really is measured.
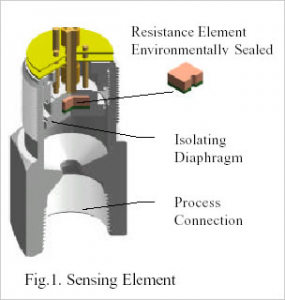
Most processpressure measurement is made using a pressure sensor where pressure is proportional to the strain of a membrane that is loaded by the pressure. Membrane strain usually is determined with the use of a full bridge Wheatstone coupling where the strain sensors are of the semi conductor type, also referred to as piezoresistive sensors. Semi conductor strain gauges are used as they show a gauge factor that is two orders higher than is the case for ordinary foil strain gauges. A pressure sensor of this type can sense absolute (LP) pressure inside the volume to which it is mounted or absolute pressure relative athmospheric pressure, Figure 1.
Figure 1. Pressure sensor with resistive gauges placed on its membrane. Link
Most industry type pressure sensors produce a 4mA to 20 mA output signal, though voltage and other output types exist. A typical frequency range would be from DC to a few hundred Hz and less than a kHz. One limitation to correct pressure sensing would be mechnical resonance in the membrane. Amplitude range would be limited by the Signal to Noise ratio of the Wheatstone bridge which usually is in the ballpark 40 dB. Signal to Noise ratio can be quite good as the whole circuit bridge-to-amplifier tends to be encasulated inside the pressure sensor and thereby is electronically shielded.
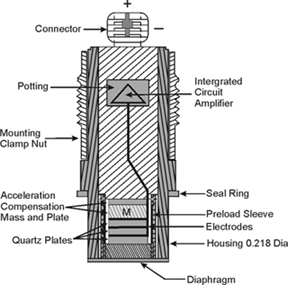
Another type of pressure sensor is the piezoelectric pressure sensor where a piezoelectric crystal emit a charge signal that is proportional to pressure. Any strain on a Piezoelectric crystal produces charge output and thus, Piezoelectric crystals react to temperature. This is one reason why many Piezoelectric strain sensors use a mechnical membrain and liquid volume between the crystal and the pressure fluctuating medium. Other reasons would be that a fluid coupling the pressure sensing membrane to a stiff crystal produces a much higher resonance frequency than the above mentioned membrane type pressure sensor. This naturalfrequency depends on the dimensions involved but many piezoelectric pressure sensors show a resonance frequency in the ball park 100 kHz and higher. It therefore follows that a piezolectric pressure gauge by far is more phase accurate than is a membrane type pressure sensor, Figure 2.
Figure 2. Piezoelectric pressure sensor with built in signal conditioning. Link
Due to the thermal sensitivity, a piezoelectric pressure sensor signal is high pass filtered and react only to changes in pressure that are faster than the high pass cut on frequency, which usually is about 1 Hz.
The charge output that is emitted by the crystal is a weak signal that needs amplification. This amplifier can be integrated within the pressure sensor or placed at a distance from the sensor in a separate signal conditioning unit. The latter is the usual practice for systems warmer than 120 C as the amplifier tends to emit noise when warm.
Vibration affects pressure sensors that produce erroneous readings. Some types of piezoelectric pressure sensors use a portion of their crystals to produce a compensating charge output to cancel acceleration loading. Sensors of this type are referred to as acceleration compensated.
That said, all types of pressure sensors that protrude through a wall to contact the pressurized medium produce signals that are influenced by how they are mounted. A pressure sensor dynamic signal, irrespective of type, is ruined if gas bubbles form in front of its membrane. Its attachment to the wall must be stiff for correct pressure sensing and it should stick a short distance into the flow and be aligned in parallel with the flow to correctly capture pulsation. The distance the pressure sensor should stick into the flow can be calculated.
There exists other types of pressure sensors, e.g. capacitive, but application of such is rarer. The principle used is very similar to that used in older types of microphones (see next tab).
Sound
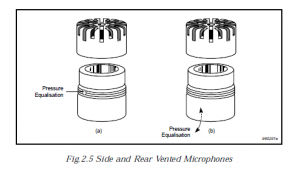
Sound pressure is measured to mimic how the human ear reacts to pressure variation. The human ear is good at suppressing LP and KP and thereby react only to what is referred to as pulsation in the above subsection. Therefore a microphone always is vented, i.e. the cavity behind the sensing membrane is open to produce the same LP on both sides of the membrane - just as for the human ear, Figure 1.
Figure 1. Microphones are vented to remove the effect from (ambient) Line Pressure and minimize the effect from Kinetci Pressure (vind). Link
This arrangement does to some extent suppress also the influence from KP but as KP usually is faster than is LP fluctuation, a microphone does well to suppress KP by the use of a flow restriction of some sort. Outdoor microphones usually have a foam glove around them and studio microphones use a wire membrane to stop flow (KP) from influencing the membrane. When wind direction is known, e.g. in a wind tunnel, special caps can be used to suppress KP, Figure 2.
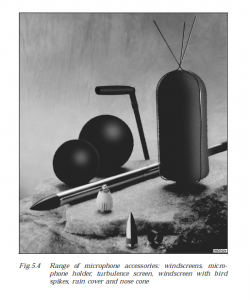 Figure 2. Various means of suppressing Kinetic Pressure for microphones. Link
The fact that a microphone is vented implies that it has a lowest usable frequency. Again, reference is to the human ear which stops sensing sound (= tones) at about 20 Hz. Note that the ear does sense pressure fluctation below 20 Hz, only it does not sense such fluctuation as tones (=sound), which is why this frequency range is referred to as infrasonic or infra sound.
The microphone diameter limits the highest frequency at which a microphone can be considered to pick up sound at a point. The larger the microphone diameter, the lower this limiting frequency, Figure 3.
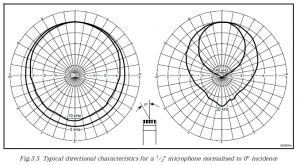 Figure 3. Microphone directivity depends on the microphone's dimension as compared with the acoustic wavelength. Microphone size is a trade off between sensitivity and frequency range. Link
Microphones used for singing usually are of the dynamic type, i.e. a cone loudspeaker used in reverse. Such microphones are rarely used for technical measurement because of cone resonance and a relatively high lowest resonance frequency. They are more robust for handling though.
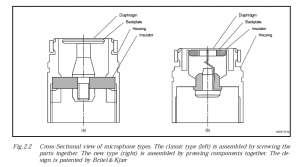
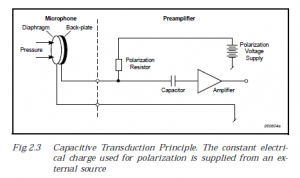
Measurement micriphones tend to use a prestressed membrane which movement is capacitively sensed. To sense a change in capacitance, the microphone must be charged by a polarizing voltage. Older microphone types use 200 V polarisation while modern types use a lower voltage, at the cost of a higher noise floor for the sensor, Figure 4.
Figure 4. Principle for capacitive microphone.Link
Lower cost microphones use a prepolarized membrane. Such microphones are readily found in cell phones, video cameras and similar. The frequency response of such microphones actually is quite good and nearly on par with that of a top of the line microphone, though it does not meed Class 0 requirements.
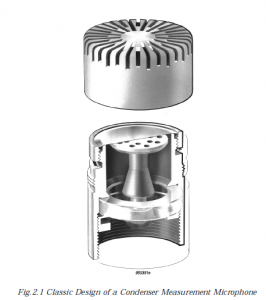
The front part of a measurement microphone, the grille, is designed for different types of sound fields, e.g. free field - where a directional sound field is expected or, diffuse field where all incidence anges are equally probable, Figure 5.
Figure 5. Microphone capsule. The grille is the top element and its shape differs with the sound field the microphone is intended for. Link
Mechnical Strain/Stress
To start, we sense mechanical strain, ε, to assess mechanical stress, σ, using Hookes law,
i.e σ =Y·ε . Therefore, we must know also the material's Young's modulus.
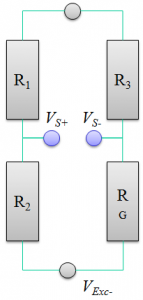
The most common strain sensor type is the resistive foil sensor. This sensor changes in resistivity when strained and this change in resistivity is typically sensed using a Wheatstone circuit, Figure 1. The Wheatstone circuit uses a constant voltage source, VExc, to drive it and the sensed bridge signal is VS.
Depending on whether one, two or all four elements are used to sense strain the setup can be used to sense or suppress the effect from temperature, sense or suppress from load directions, etc. The use of a single strain sensing element is referred to as a quarter bridge (RG), two elements form a half bridge (R3 & RG or R1 & R2) and all four form a full bridge.
Figure 1. The Wheatstone bridge. (Click figure to expand)
To exemplify the sensing and suppression of temperature, placing one gauge on the object of interest and three sensors on an unloaded thermally inert position, we create a way to pick up strain versus temperature. Placing all four sensors next to each other on the object, we remove the sensitivity to thermal effects. The effect from thermal stress can be electronically suppressed as well, simply by imposing a high pass filter on the VS signal.
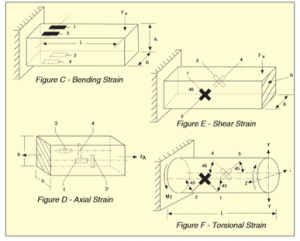
Similarly, if we wish to pickup axial stress while ignoring thermal influence, we use a full bridge connected as shown in Figure 2(D), while the full bridge setup shown in Figure 2(C) suppresses axial strain and promotes the sensing of bending strain etc.
Figure 2. Strain sensor arrangements. (Click figure to expand) Figure from Link
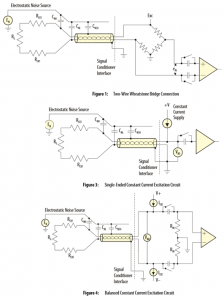
Other types of electronic circuits than the Wheatstone bridge exist, e.g. Single Ended constant current excitation, balanced constant current excitation. The strain gauge excitation can be frequency modulated to suppress noise as well.
Figure 3. Various circuits and associated noise mechanisms. (Click figure to expand) Figures from document Link .
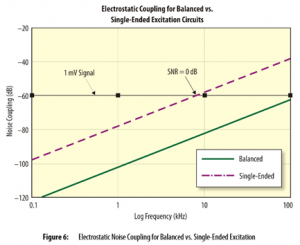
Figure 4 shows the Signal to Noise ratio for the Wheatstone circuit, SE- and balanced- constant current drives. As can be seen, much can be gained in using alternative forms of sensor excitation.
Figure 4. Various excitation circuits and their Signal to Noise ratio. (Click figure to expand) Figure from document Link
As we sense a change in resistance, we must use flat cables to avoid phase shifting the signal. This leaves the cabling vulnerable to external electromagnetic sources. Unfortunately, external electromagnetic sources may provide a signal that is stronger than the voltage produced by the strain gauge. The balanced constant current circuit and the frequency modulated excitation avoid this difficulty. Other couplings can suppress such excitation by the use of low pass filtering which limits application of strain gauge to frequencies below 50 Hz or 60 Hz depending on the power system in use.
Another way to suppress electromagnetic excitation is to improve the gauge output. The Gauge Factor, GF, is defined as GF = ΔR/RG/ε, where the strain gauge average resistance is RG, the resistance change is ΔR. A foil type usually has a Gauge Factor of about 2, while a semiconductor type strain sensor has a GF that is two orders of magnitude large. One way of increasing output, therefore is to use a strain gauge with a larger GF, the other way is to supply the gauge with more electric power which can be found from the combination of strain gauge resistance, RG, and the type of excitation (Constant voltage- or constant current- excitation). That said, there is a limit as to how much power a strain gauge can be input as it will expand and thereby try to impose strain on the measurement object. The end result of this imposing/sensing balance is referred to a self noise. In practice, we end up with a sensor power in the ball park of 0.25 Watt or less.
To exemplify, a 120 ohm sensor with GF=2 and a 1 μstrain produces as restinace change
ΔR =2·120·1E-6 = 0.24 milliOhm. If we excite the bridge by 10 V, the gauge will have (5/120=) 42 mA current (0.22 Watt gauge power), we generate a voltage signal of ΔV = 0.24E-3·42E-3 = 10.1 μV, i.e. we generate 10.1 μV/μStrain. This signal strength is indeed tiny.
As indicated in Figure 4, the Signal to Noise Ratio (SNR) can be greatly improved using constant current excitation, where Single Ended constant current excitation improves SNR by ~40 dB and balanced constant current excitation improves SNR by ~80 dB.
Another type of strain sensing element is the piezoelectric type. As for pressure measurement, it does not sense absolute strain. The piezoelectric sensor emits charge and therefore has the advantage that it can use coaxial cabling which shields its signal from electromagnetic excitation. Furthermore, a tiny amplifier can be placed with the sensor or close by and thereby further increase the signal to noise ratio.
To exemplify, one piezoelectric strain sensor, PCB 740b02, has the sensitivity 50 mV/μStrain, i.e. a 4,960 (74 dB) times higher voltage per μStrain. This higher output combined with the shielded coaxial cabling that can be used for this sensor implies that a transducer of this type by far outperforms the foil gauge/Wheatstone bridge combination for dynamic strain measurement.
(A)
(B)
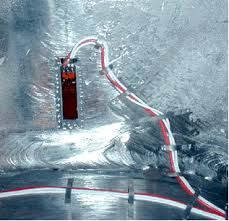
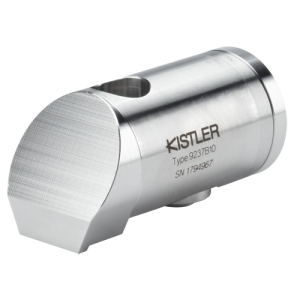
Figure 5. Examples of strain gauge types. a) Resistive foil gauge. b) Piezoelectric with built in amplifier. Link
Strain sensing amplitude ranges for the above mentioned sensors are
- Foil strain gauges - max ~50,000 μstrain with the lower value depending on electronics and cabling.
- Semiconductor strain gauges - 1,000 μstrain to 10,000 μstrain with the lower value depending on electronics and cabling.
- Piezoelectric - max ~300 μstrain with the lower value depending on electronics and cabling.
As a rough guide on strain sensing:
- Foil sensors and the Wheatstone bridge are best used for the static to 50 Hz range and for relatively large strain fluctuation. Typical application would be static to low cycle fatigue and/or environmental stress sensing, say down to ~10 μstrain.
- Use of alternative circuits can extend the 50 Hz limit to higher frequency and allow sensing of lower strain amplitude, say down to 0.1 μstrain to 1 μstrain.
- For strain sensing up to higher frequency and of low strain amplitude, piezoelectric strain sensing is preferred. Mechanical load is best estimated in areas away from stress concentration. Such areas tend to have lower strain which makes piezoelectric sensors good candidates for such tasks.
A word on adhesion. The strain sensor must be attached to the structure where it should sense strain. This usually is made using glue but there are types of strain sensors that can be flame sprayed or micro spot welded to the structure. The latter types typically apply for high temperature strain gauge sensing, which is a topic in itself. Therefore, the above mentioned discussion typically applies for strain sensing at temperatures below, say 120 C.
Last - a general problem with strain measurement usually is that a single sensor cannot be expected to measure the hot spot stress. Therefore, one approach is to measure at a distance from the expected hot spot stress region where stress is the more uniform and there determine typical strain and to use analytically or, FE computed, Stress Concentration Factors (SCFs) to scale measures strain/stress for an estimate on hot spot mechanical stress/strain.
More on strain gauge measurement can be found in the Recommended Reading section.
Vibration
There are many types of vibration sensors available. In this section we will start by mentioning some types and thereafter concentrate on the most common types in current use.
Vibration can be picked up using
- Vibration sensors and seismometers.
- Piezoresistive and strain gauge based accelerometers
- Piezoelectric accelerometers
- DC Accelerometers
- Vibration lasers
A historic overview of accelerometer development can be found here: HistoryOfTheAccelerometer
For those interested in curiosa, it may be fun to know that Murphy's law originated from strain based measurement of acceleration on a jet engine powered chair, Link
The reader advice is to assure a thorough understanding of the Single Degree of Freedom system (sdof) before continuing to read this section.
To start, a vibration sensor can be single axis, bi-axial or tri-axial. All three versions exist.
Vibration Sensors and Seismometers.
These are similar to the dynamic microphone, i.e. they are in essence a loudspeaker run backwards where the speaker membrane is replaced by a mass, a coil is moving in a permanent magnet gap, Figure 1.
Figure 1. Principle sketch of velocity sensor and seismometer. The seismic mass M (blue) is suspended from springs that extend from the sensor house (green). A coil moves in a the gap of a permanent magnet (yellow) and a voltage is induced to the coil wiring as a result. As it is the relative motion that generates the voltage, the seismic mass must be stationary for the sensor to correctly sense vibration.
A signal output that is proportional to vibration velocity is generated once the mass element stands still, i.e. at a frequency ~3x higher than the unit's mass-spring resonance. This implies that a wide frequency range requires a reasonably low resonance frequency and/or the use of gain compensating filters.
Seismometers often have a low resonance frequency, say 1 Hz to 5 Hz, and as a result tend to be heavy. Vibration probes usually are lighter and some rely on gain compensating filters. Any system that passes resonance will experience a 180 degree phase shift on passing through resonance plus amplification, unless critically damped. A problem in the use of such filters is that the probe damping and resonance frequency must be determined and must be matched by the filter.
Piezoresistive and strain gauge based accelerometers
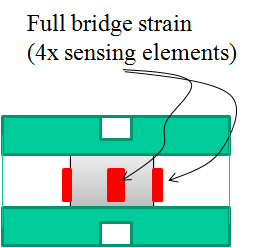
A next step in sensor development was to use instead a sensor that operates below its fundamental resonance, i.e. in the stiffness controlled area. This approach favors the use of lightweight rather than heavy sensors as light and small sensors have a high resonance frequency. The first accelerometers used a full Wheatstone strain gauge bridge - much in the same way as strain based load cells do, Figure 2.
Figure 2. Strain based accelerometer. The blue box shows the seismic mass and the red surfaces show the resistive elements that are connected in a setup that reacts to compression (see strain section for more information). Acceleration is derived using Hooke's law and Newton's second law, i.e. from solving the equation Mass·Acceleration = Y·ε, where Young's modulus is Y and strain is ε.
As discussed in the strain section, a semiconductor or piezoresistive element has a considerably higher Gauge Factor and thus, generates a much higher signal output. Modern descendant therefore use piezoresistive elements. Such accelerometers are typically used for impact, shock, explosion and similar measurements.
Practical use of such sensors is more cumbersome as it usually involves the use of more cabling than is the case for piezocharge accelerometers.
Piezocharge accelerometers
Piezocharge accelerometers currently (2014) is the most common accelerometer type for professional measurement tools. A seismic mass is resting on top of a piezoelectric crystal and the sensor is hermetically sealed, Figure 3.
Figure 3. Piezocharge accelerometer. The gray areas show the Piezochrystal and the blue areas show the seismic mass.
The charge output signal is very weak. The main advantage lies in the piezoelectric cell's large dynamic range which is about 180 dB and enables the design of a very stiff support for the seismic mass and thus, a very high natural frequency. The main attraction with this arrangement is that use of a sensor very much below its natural frequency provides phase accurate response.
From the beginning, the accelerometer used a charge output, a high quality cable with low tribologic charge generating properties connected the sensor to a charge amplifier. This setup is still in use but mostly for high temperature application, i.e. places where sensors are used at temperature higher than 120 C (to 150 C for recent models).
The charge amplifier was later moved into the sensor house by the use of external constant current excitation. The constant current excitation can be 2 mA to 20 mA or, 4 mA to 20 mA at 18 Volt DC to 30 Volt DC depending on the specification. A high pass filter removes the DC offset that is provided by the excitation. This circuit goes under many trade names, e.g. ICP (PCB Piezotronics), Deltatron (Bruel & Kjaer), Isotron (Endevco), IEPE (Dytran, Kistler, National Instruments, etc). The circuit is shown in Figure 4 below.
Simply put:
- The lower the exciting current the lesser the built in amplifier self noise and hence, the better the Signal to Noise ratio.
- Long cables require a higher constant current excitation for high frequency response, see Link.
- The higher the excitation voltage, the larger dynamic signal voltage range.
Figure 4. ICP circuit where the constant current source emits the current I, the high pass filter is comprised by the capacitance C and the resistor R. For further explanation and discussions, see Link .
A piezocharge chrystal outputs charge whenever it is exposed to deformation. This implies that it reacts not only to the load imposed by the seismic mass but also to thermal loads. This thermal load usually is low frequency. If the sensor is thermally insulated and kept at fixed ambient conditions, a piezocharge sensor can measure to very low frequency. Note that ample time then must be given also for the built in amplifier to warm up and reach steady thermal conditions.
For daily practical use, the high pass filter is adapted to the accelerometer design and usually lies in the span 0.5 Hz to 3 Hz. Some Seismometer accelerometers go down to 0.05 Hz while industry type accelerometers that are used for condition monitoring with short warm up and is moved between hot/cold conditions en route would use the 3 Hz or higher setting.
To continue, the early piezocharge accelerometers used a simple compression design. This design is sensitive to base bending and react quicker to thermal loads. The accelerometer casing can pick up also sound and emit a false signal. Later types changed to balanced shear type configurations that are less susceptible to base bending and acoustic loads.
Piezocharge accelerometers are not used for strong shock loads for the simple reason that when integrating acceleration to displacement, it does not do its job as well as does the piezoresistive type. The reason is that the Piezocharge chrystal produces a DC charge offset after a shock spike and this DC offset disrupts the signal processing as the offset accumulates to the displacement signal.
The physical reason for this DC charge offset turns out to lie at the piezochrystal lattice where molecule chains shift inside the lattice. This shift is not permanent, but of sufficient duration to upset the signal integration when the accelerometer is highly loaded. Therefore, always examine the amplitude range for which the accelerometer is designed.
To provide some ideas. Seismic accelerometers tend to be designed for, say max 2 g acceleration, and thus, become overloaded and take time to recoup when badly handled. Low sensitivity IEPE type accelerometers can handle acceleration up to 1000 gPk. The usual 100 mV/g industry type accelerometer can handle 50 gPk.
DC Accelerometers
Current bulk accelerometer use is MicroElectroMechanical Systems (MEMS) type sensors. This type of sensor is used in cell phones, game consoles, tablets and similar devices. Modern devices usually have a triaxial accelerometer built in and as the sensors can sense DC acceleration, the gravity vector is used to decide which way is up for the device.
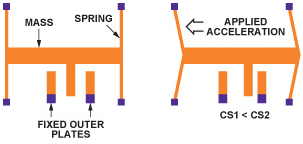
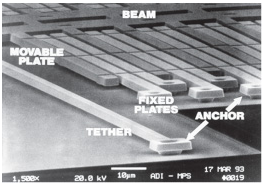
MEMS sensors usually are based on capacitive monitoring of the motion for a small (1 um to 100 um sized) cantilevered beam, Figure 5. The sensor is tiny and its signal output is tiny which is why the amplifier is placed close by.
(a)
(b)
Figure 5. MEMS type accelerometer. a) Principle. b) Physical realization. Figure and photo from Link
MEMS sensors have ratiometric output, i.e. the Acceleration/Volt output depends on the DC input with which the sensor is powered. Ratiometric output enables a MEMS sensor to be adapted to many voltage ranges. Recent MEMS sensors have abandoned analog output in favor of digital ouput.
Navigation class accelerometers that are used for strap down inertial navigation tend to be based also on capacitive monitoring of a larger seismic mass. This improves the signal to noise ratio as a larger signal is generated.
General comments on accelerometers
Most accelerometers, regardless of type, has about 2% cross axis sensitivity. This sensitivity usually originates from tolerances in the positioning of the sensor mass. Therefore, some sensors will have a cross axis sensitivity that is higher than 2% and other sensors of the same model will show a lower cross axis sensitivity.
Accelerometers must be firmly attached to the measurement object to correctly sense its acceleration. The mounted resonance frequency, i.e. the resonance frequency when the sensor is attached to the measurement object often is much lower than is the accelerometer resonance frequency. Mounting, therefore, affects phase accuracy and the highest frequency at which a sensor can be used.
A long and weighty cable of mass m that is vibrated at acceleration a, excerts a force on the accelerometer housing. This force infers an erroneous signal. Suppression of such loading is made by securing the accelerometer cable to the vibrating object at a location with roughly the same acceleration, usually close to the sensor.
Laser Sensors for Vibration
The laser displacement type of vibration sensing sensor principle is based on a laser diode that emits a laser signal and a light sensitive cell that detects where the reflected beam impinges, see Figure 6. A high performance sensor of this type is used to characterize loudspeaker elements and hence, can track motion across the audio range and with displacement amplitude down to 1 um. The sensor outputs a DC signal with a superposed AC signal, i.e. position (DC) plus vibration (AC).
For field use, a limitation lies in the fact that the sensor must remain stationary and measure on a flat surface truly to track its vibration. Imagine replacing the flat surface in Figure 6 with a cylinder an moving it in a plane that is parallel with the sensor.
Figure 6. Laser displacement sensor. The laser diode (black/white) emits a laser beam (red) at an angle which, is reflected back onto a linear image sensor(yellow/black) which detects at which position the beam strikes the element.
A laser doppler vibrometer outputs a signal that is proportional to vibration velocity. Its function principle is that a Helium Neon laser with a well known and fix wavelength (and hence, a well known frequency) emits a beam which is split into two parts. One part travels to the object and upon being reflected by the surface, the laser beam is doppler shifted. The other part of the beam is diverted into a Bragg cell, where the reference signal is frequency shifted, Figure 7.
The two beams are then merged and the difference in frequency between the reference beam without doppler shift, f0, and the reflected and doppler shifted signal input to a photodetector to produce a signal proportional to vibration velocity.
Figure 7. Laser Doppler vibrometer, function principle, from Link . See this reference also for a better explanation on the function principles involved.
A word on practical use of Lasers:
- Laser vibrometers have the obvious advantage in that they do not add (much) mass to the measurement object (remember - photon carry momentum - so there is a load, however tiny).
- Similarly, a laser does not have problems with warm surfaces and it can be applied from a distance.
- A laser beam can be reflected by a mirror and therefore, 'measure around a corner'.
- There exists scanning laser vibrometers that use mirrors to move the beam and map vibration fields. A demo of such a device is found here: Link
- Also, it must be remembered that a laser is no more than a single channel and that it by itself does not have any information on its angle of incidence. As a response, 3D scanning lasers (in essence just 3x scanning lasers) have been developed, see here for a demo Link (Note that the process made here is what is achieved when a single triaxial accelerometer is moved from one position to the next position. )
- A problems is that lasers do not favor raw metal surfaces as the microsurface of such greatly modified the reflected angle and thus, the reflected light intensity. Painted surfaces or better, reflex tape/paint greatly improves the situation.
- Lasers tend not to like too much slow large motion amplitude as they rely on focusing for the laser beam.
- A laser can only pickup what is 'visible' to the laser beam.
Load
Load or force cells share common traits with accelerometer designs. A load cell based on strain sensing is shown in Figure 1 and can be compared with the strain based accelerometer (Figure 2 of previous tab)
Figure 1. Strain based load cell based on full Wheatstone bridge. The amplification circuit tends to be integrated with the load cell for improved signal conditioning (similar to that of the pressure sensor).
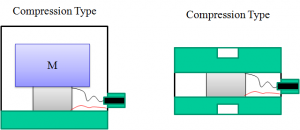
A piezoelectric force sensor shown in Figure 2 is similar to the compression type accelerometer design .
Figure 2. Left - A compression type accelerometer. Right - A piezoelectric force sensor.
Temperature
Temperature measurement is a vast subject as it is one of the older measurement types. We will limit ourself to a brief listing of the most common temeperature sensor types and their function principle and then refer the curious mind to pages that are devoted to the subject.
Temperature sensor types
- Thermocouples are made from two metals that join at a temperature sensing tip. Mixing two metal creates a voltage. This is the so called Seebeck effect aka the Thremolelctric effect, Link. The larger the temperature, the larger the created voltage.
There exists thermocoupled of types E, J, K (Kantal), N (Nickel), T, R , S, B, Pt100 (Platinum) - where types K, N and Pt100nowadays are the most common. As mixing of metals cause a voltage, the measurement chain must remain as balanced, metalwise, as possible. Therefore a thermocouple should usethe extact same kind of metal that lead to the measurement tip and the metal types must not be switched or new, untwanted, temeprature probes are created. - Resistance Temperature Devices(RTD) rely on the fact that materials change density with temperature and hence, that a wire changes dimensions with temperature and thereby, that a wire changes resistance with temperature. There exists metallic RTDs and thermistors (ceramic semiconductors). RTDs are passive elements and must therefore be excited by a current to measure the resistance change with temperature.
- Fluid-Expansion Temperature Measurement Devices function like old style thermometers, i.e. a fluid contained in a narrow volume expands/contracts with temperature and a scale is fitted such that the volume change scales with temperature.
- Infrared Temperature Measurement Devices (Pyrometers and IR Cameras) use infra red light to determine an object's temperature. They differ from the above types in that they are non-contact types of sensors.
More information on temperature measurement can be found, e.g. here: Link, Link, Link
Position
Position invariably is determined relative to a reference position. Position can be measured in many ways and some of the more common are listed here:
- Mechanical gauges can be used to detemine position relative to a reference. The simplest is a ruler that measures in a single dimension and complexity extends to XYZ tables that become the more expensive the larger the dimension and the higher the precision.
- Time based systems use a well defined reference like a well known wavelength and propagation speed as in Time of Flight Lasers. The objective tends to be to determine sgement lengths and determine XYZ position using trilateration, i.e. segment lengths of triangles formed between observation and reference positions. Error analysis of trilateration equations shows they have forgiving fault tolerant propeties. There exists acoustic based systems where short pulses are emitted and picked up by four microphones positioned ina well defined XYZ system. Such systems have relatively low precision as they are affected by wind.
- Intertial systems aka 'gyros' use accelerometers and rategyros that measure rotation velocity. Interial methods are the common for navigation of ships and aircraft. Absolute position precision is limited as the position error grows with the cube of time. Intertial systems are advatageous when determining position fast and between reference positions, e.g. as provided by GPS. Intertial measurement systems are divided into Strategic, Navigational, Tactical and Consumer grades where system prices would range from several MUSD for the former to a few USD for the latter.
- Angle based systems use triangulation and determine angles between observation positions and trigonometry. Angle is easy to measure which makes this a common method for surveying.
- Digital systems use finely etched glass where transmitting and blocking stripes are made. The etched glass may be a long strip or a circular disc. The former is a linear encode while the latter is a rotary encoder. Etching can be made to high precision and position be determined very accurately at low cost simply by counting pulses. Refined systems use A/B/Z channels where the A/B channels are shifted 90 degrees and the Z channel emits one pulse per 360 degree revolution. A/B/Z channel systems can sens back/forth motion and position while a system with only channel A would be fooled if motion is back/forth and work when motion is monotous.
- Photogrammetry uses calibrated camera images from mutliple locations with reference poisitions and reference objects with well known dimensions to determine shape, i.e. global position of many points. Photogrammetry is a high precision method with an accuracy of up to 1:30,000.
- Structured light systems is a recent method where a known patter, say rectangular, is emitted by a projector and read by a camera. The light pattern can be visual or infrared. The pattern distortion reveals the shape of the object and if time of flight is used, the depth dimension can be directly measured. Low cost devices like Microsoft Kinect uses this type of method. There exists professional versions and even systems of this kind that are capable of determining varying 3d geometry in real time.
Flow
Flow can be meausred using a multitude of ways. We will limit ourselves to volume, ultrasonic and pressure drop methods.
- Volume methods, simply put, is using a bucket of known volume and a clock to determine the time required to fill the volume. Flow velocity is found from this and pipe dimensional information. The volume method is simple and well defined and therefore, a reference method for flow measurement. A disadvantage is that the approach is highly impractical in many (most) situations and that information regarding flow is delayed until the reference volume is filled.
- Pressure drop, aka dP, uses the fact that a known pipe cross section change force flow to travel faster through the constriction. This velocity change causes a pressure difference upstream/downstream the contriction that can be sensed using a relative pressure sensor that senses upstream/downstream pressure or from two pressure sensors that independently sense upstream/downstream pressure. This arrangement can be fooled by pulsation where acoustic waves in the pipe affect the pressure differnce reading and/or pulsation in the tubes leading to the pressure sensor(s) may experince local acoustic resonance. The remedy is low pass filtering signals and keeping pressure sensor lines short.
- Ultrasonic flow meters rely on the same principles as in exho sounding, i.e. pipe dimensions, pipe material and time being known. A high frequency pulse is emitted and picked up by a sensor that can be placed on the opposing side of the pipe or picked up as the sound bounces on the opposing wall. A pulse is then emitted in the opposing direction. Working this information reveals the wave speed and the flow velocity as the trip in one direction is governed by wave speed + flow speed while the trip in the other direction is wave speed - flow speed.
Ultrasonic flow meters are convenient for liquid flows as they can be clamp on external sensors. For gas systems, one tend to have to use protruding sensors, i.e. sensors that penetrate into the pipe. A limitation is that flow must be reasonably steady and that the cross section flow profile must be good natured, i.e. with limited amount of turbulence.
By signal analysis is implied the transformation of a signal for a modified purpose. This transformation may arise in the same domain the signal was digitized or transform the signal from one domain to another.
To clarify and define, by the phrase domain is hereby implied domains such as
- Time [s]
- Revolution (or Angle) [-]
- Wave length) [m]
- Frequency [Hz = 1/s]
- Order [-]
- Wave number [1/m]
The overshadowing purpose of a transformation is to modify a signal to better show information that we are seeking.
Simply put, looking at a the information contained in a signal using multiple transforms is analogous with the examining an object from multiple views, looking inside/outside or normal to/along a surface.
Single domain transform are Engineering Unit (EU) to 1/EU transforms.
Certain natural transformation pairs exist, namely
- Time [s] <=> Frequency [Hz = 1/s]
- Revolution [-] <=> Order [-]
- Wave Length [m] <=> Wave Number [1/m]
The most common is the Time-Frequency pair though, the transforms are identical for the other pairs. Therefore, we confine discussion to time and frequency.
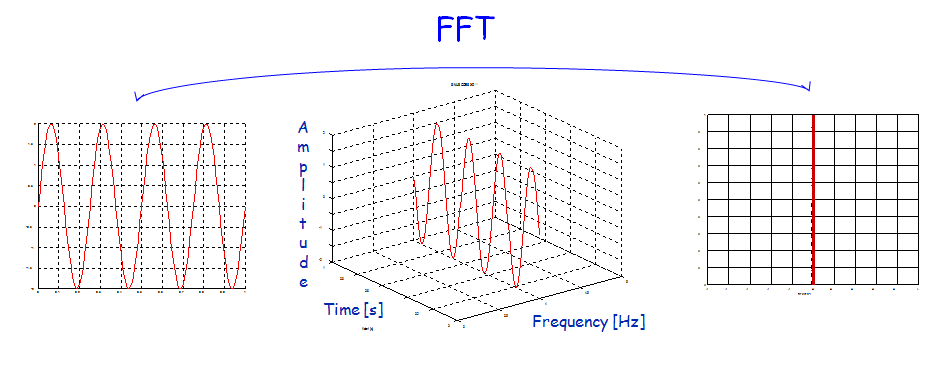
Let us start with a sine wave x = X*sin(wt). The sine wave amplitude is X, the angular frequency is w, and its frequency is f [Hz]. The sine wave repetition distance as measured in time is referred to as the period time T [s]. The relation between time and frequency for a sine wave is that f = 1/T. Now, as demonstrated - we can look at the sine signal in the time and spectral domain at any given moment. Therefore, we should be able to combine these into an integrated figure, a so called spectrogram. Figure 1 shows all three view and how they relate.
Figure 1. Time and frequency for a sine wave. A) Time domain view of the sine signal. B) Frequency domain view of the sine signal. C) Spectrogram view of the sine signal.
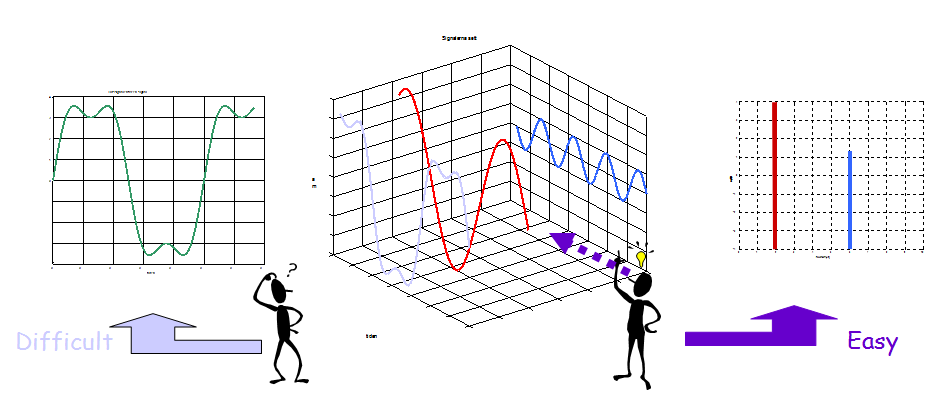
Next, if we mix two sine wave signals such that x = X1*sin(w1t) + X2*sin(w2t), we expect two spectral (frequency domain) components f1 and f2. Figure 2 shows the signals from multiple view.
Figure 2. Time and frequency for a compounded wave. A) Time domain view of the signal. B) Frequency domain view of the signal. C) Spectrogram view of the signal.
As readily can be seen in figure 2, information (e.g. amplitude) that is hard to obtain from one (time) view is readily obtained in the other (spectral) view.
The sine wave is extreme in the sense that it is infinite in the time domain and thus, exists only at a single frequency.
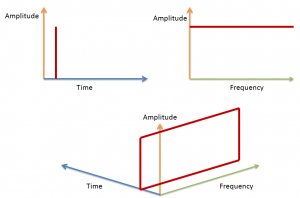
The corresponding signal in the time domain is the Dirac pulse, i.e. a pulse of amplitude X and zero time duration. Figure 3 shows the Dirac pulse. As can be seen, it exists with amplitude X at all frequencies, i.e. up to infinite frequency.
Figure 3. The Dirac pulse which is an impulse of unity amplitude and zero time duration. Top left) Time domain view of the signal. Top right) Frequency domain view of the signal. Bottom) Spectrogram view of the signal.
The rule of thumb is that a signal that is short in one domain is long in its domain pair.
For finite duration impulses of duration τ seconds, Figure 4,the rules of thumb are that
- Amplitude is constant up to a frequency 1/τ
- 90% of the signal energy is found at frequencies below 2/τ.
Figure 4. Finite duration, τ seconds, pulse. A) Time domain view of the signal. B) Frequency domain view of the signal.
Any signal that is not harmonic is continuous. The spectrogram of a finite duration pulse does therefore span both views and would looks like a set of 'hills' in a spectrogram.
Last, but not least - the transform is energy correct which, implies that it will be incorrect at a given poiint in time or frequency. The error size depends on the situation.
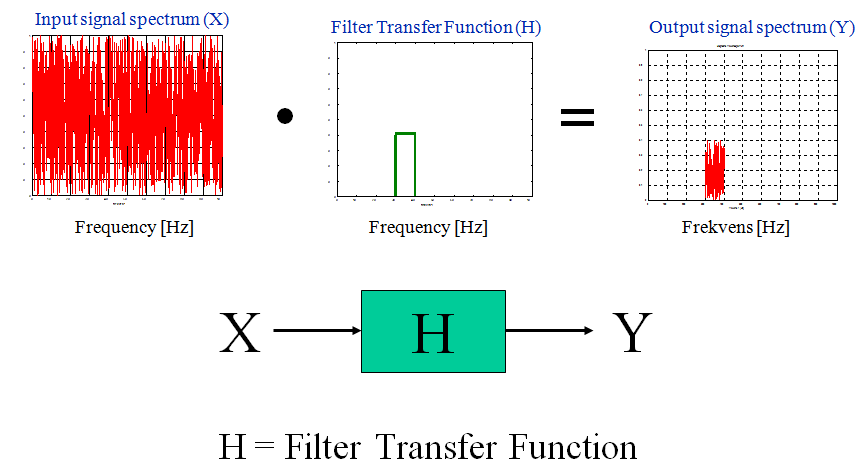
An input signal X, is affected by a filter such that a signal Y is output. The filter transfer functio is then stated to be H = Y/X. The filter effect is the simplest to understand in the frequency domain, Figure 1.
Figure 1. The effect of a filter H on an input signaö X resulting on the output signal Y.
A filter can be implemented using physical components, e.g. resistors, capacitance and inductance, or be implemented using numerics/Analog Digital conversion.
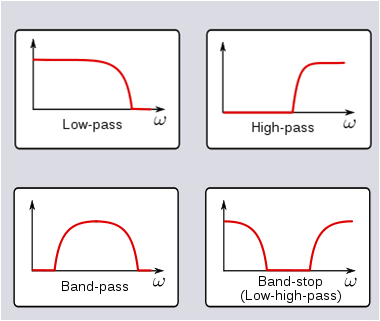
The most common type of single domain transform is filtering. Figure 2 shows the most basic filter functions:
- High Pass
- Low Pass
- Band Pass
- Band Stop
Figure 2. Basic filter types. From:Link
A filter is characterized by its
- filter type
- corner frequencies
- the slope at which cut off is implied.
Filtering is an exhaustive topic. More information of filters can be found here:Link
Other common types of filters are Octave- and 1/3-Octave frequency bands. These filters have a constant relative bandwidth, i.e. Δf/fc = Constant, where Δf is the frequency bandwidth and fc is the frequency band centre frequency. As implied by its name, there are three 1/3-Octave frequency bands in one Octave band. As implied by its name, the band centre frequency is doubled from one Octave band to the next.
The 1/3-Octave frequency band centre frequencies are selected to mimic those of the human ear.
Other common filters are:
- A-, B-, C- weighting
- ISO human vibration filters for hand-arm and whole body vibration
- Integration and derivation
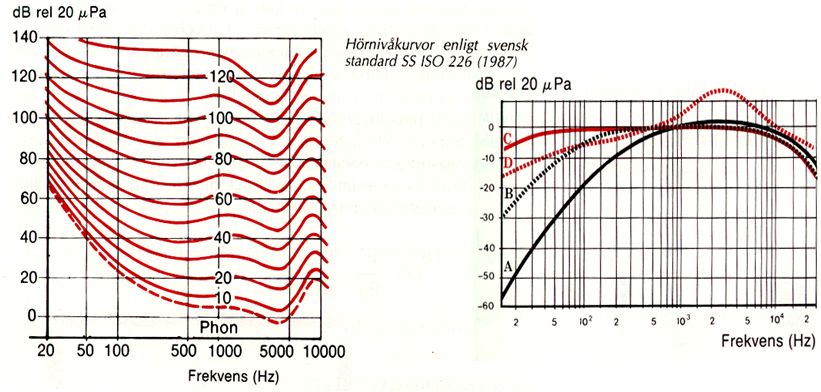
The A-, B-, C- weighting filters are shown in Figure 3 together with the Phon curves. A Phon curve is a constant loudness curve. As readily can be seen, the A-, B-, C- weighting filters are simplifications of the Phon curves. The intention with these filters were to present a single value on the perceived sound strength where A-weighting was intended for weak sounds and C-weighting for strong sounds. Differently put, these filters are introduced to mimic the human ear weighting of sounds of different strengths.
We note in passing that the function of the Loudness filter is a simplification of the A-weighting filter and that its function is to make a weak sound be perceived as louder, i.e. the loudness filter should mainly be used when playing music at low volume.
Figure 3. .Phon curves, A-, B- and C- weighting filters. A Phon curve is interpreted such that if a person with perfect hearing is exposed to a signal, say of 1 kHz to the left ear. The phone curve is the strength required to match the perceived loudness for a tone injected to the right ear.
Similarly, the ISO human vibration filters are implemented as the human body shows a frequency varying sensitivity to vibration exposure. There exists a bunch of similar filters for motion sickness as well.
Last, integration and derivation filters, e.g. transforms acceleration time signals in m/s2 to m/s or m. In this transform, the domain itself is in the integrator.
A signal can be transformed between the time and revolution domains by correlating these domains. The most common example is that of rotation where a time signal can be transformed to the revolution (rotation angle) using one or more reference pulses on the rotating component.
Revolution has no unit, so turning one full revolution, i.e. completing one revolution period, happens at Order 1. A harmonic component with N periods per revolution has Order N.
At fixed speed, the relation is straightforward as the shaft rotation speed is N Rotations Per Minute (RPM), i.e. N/60 Rotations Per Second [RPS]. Rotation has no unit, so RPS has the unit 1/s, i.e. the same unit as frequency. Therefore, 1 Order is at the RPS frequency, aka the machine frequency. Similarly, components that lie at Order N arise at the frequency N*RPS.
Using a single or several triggerpulse(s) on the rotating shaft, a time signal can be transformed from the time domain to the revolution domain and from there to the Order domain. An example of this is found here: Link
Transformation from time to wave number requires sampling of response to take place across space. An array of sampling points are used to sample in the wave length domain. A minimum for such transformation is to use four sampling points or the sampling criterion is not fulfilled.
Registering time signals synchronously at M positions allows transformation from the wave length domain to wave numbers below 1/(2.56*M) [1/m] in the wave number domain.
By System Analysis usually is implied use of more than a single measurement channel, often a large number of measurement channels.
Examples of System Analyses are:
- Operating Deflection Shapes (ODS), either time, spectral or with RPM or similar reference.
- Modal Analysis, either with excitation reference (EMA) or operational modes (OMA).
- Multichannel data to be used as input to a mathematical model.
In ODS, EMA and OMA, test data is combined with geometry and sensor orientation data, using a so called Test Geometry.
The last example can, for example, be a mathematical model of multi-layered soil, acoustic absorber models, material properties, vibration isolators, or a CogMOI test, i.e. a test to determine mass, inertia, Center of Gravity. Data is then usually collected in a very specific test set up with as 'pure' conditions as possible for the test purpose, e.g. in a Kundt's tube for absorber tests or in a test stand for material data.
The Test Geometry (TG) is based on the following information
- A global coordinate system
- XYZ positions for the coordinates in the global coordinate system
- Orientation of the sensor relative to the global coordinate system
- A unique number for the measurement position. This number is applied as a tag also with the measurement data record such that a measurement record can be matched with a position and orientation in the TG.
- The TG can be divided into components that are turned on/off to simplify animation.
Once the TG is fully defined, special software for the purpose of analyzing and visualizing test data can be employed to sort and match data records with the TG for the purpose of visualization.
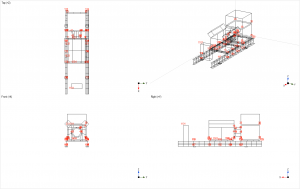
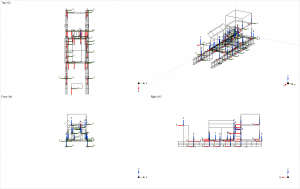
Figure 1 shows and example test Geometry, the test numbers and the local coordinate frames that show the sensor orientation.
(A)
(B)
Figure 1. Example Test Geometry. B) Test numbers. C) Local coordinate frames that show the sensor orientation.
The simplest technique for visualization of test data is Operating Deflection Shape (ODS).
ODS can be made in the time domain for N channels where the Test Geometry (TG) XYZ psoition data simply is modified by a dynamic portion dXdYdZ that originates from the measured data. This dynamic portion dXdYdZ is updated for each time increment of the visualization.
A requirement for time domain ODS is that test data either were sampled using a real time system or that a data logger with sufficiently high sampling rate was used to collect the test data.
An example time domain ODS is shown here:
ODS can be made also in the spectral domain. In fact, this is the most common approach as it allows collection of many test positions with a limited number of sensors and measurement channels.
A reference position is then selected and kept throughout the test. M scans of measurement are taken and assembled into a test set. Phase information relative to the reference position is obtained using Frequency Response Functions (FRFs) that can be either Cross Power or Transfer Functions.
Major assumptions in the use of spectral ODS are
- The system is linear
- Response is time invariant, i.e. fully repeatable and does not vary with time and operational conditions.
- The test itself is fully repeatable
A version of the spectral domain ODS is to log also machine RPM. Note that RPM can be replaced by other relevant machine parameters, e.g. flow rate, depending on the type of system that should be tested. Spectral data can then be acquired at various RPM. ODS can then be visualized as a function of RPM.
Another version of the spectral domain ODS is to record data as Order data. Animation is then made in the order domain. Again, logging of RPM is an option.
An example ODS where spectral data is recorded and sorted with respect to RPM for a compressor is shown here:Link
In Experimental Modal Analysis (EMA), excitation usually is made using either a shaker or an impulse hammer where a force gauge is in the load path. Therefore, Frequency Response Functions (FRFs) of response/force can be collected. As response, we typically measure acceleration, velocity or displacement, with acceleration being the most common response quantity.
A next step in EMA is to fit a set of modal basis functions to the test data. This fit is an inverse process, i.e. a process of the type where we know the answer to be 4 and we must identify what is the question. Therefore, it is obvious that the right answer has an infinite set of possible solutions.
In EMA, multiple modal models are tested with respect to the measured FRFs. There are certain indicators that have been developed to demonstrate whether a mode (a.k.a. pole ) is estimated with stable data for its
- Natural frequency
- Damping value
- Shape
Note that the above criteria by no means guarantee that the mode set that is identified in the EMA is a correct and physically meaningful set of modes.
There exist different methods on how to fit the modal model to the test data. Examples of such methods are: LSCF,LSCE Ibrahim Time Domain, PolyMAX.
Major assumptions in the use of EMA are
- The system is linear
- Response is time invariant, i.e. fully repeatable and does not vary with time and operational conditions.
- The test itself is fully repeatable.
- Modes can be separated, i.e. the modal overlap is 0.3 or less.
- Modes as basis function are meaningful. To exemplify, for conditions where (outdoor) free waves propagate, the use of standing (non-propagating) waves (=modes) would be a poor choice.
- A correct and physically meaningful mode set was identified in the EMA.
Self study material on EMA and FRF measurement can be found in the Recommended Reading Section:Link
An examplem EMA is found here:Link
Operational Modal Analysis (OMA) is made using time response data, usually data that is synchronously recorded. OMA originates from analysis of large scale structures where the use of a force reference simply is not possible. OMA therefore relies on 'natural' excitation sources that drive the object. In this sense, it is possible to use the dame data both fo ir a time ODS and OMA.
In the OMA, just as in the EMA, a modal model is fit to the test data. As OMA does not necessarily use a force reference, mode data then is not scaled with respect to the modal mass. OMA does produce scaled modal data when a force reference is introduced.
One thing to watch out for in OMA is that it relies on the assumption that system excitation is uncorrelated with respect to the system modes. If excitation is correlated or in some manner is time invariant (reptititive), OMA will identify this source component as a mode.
Major assumptions in the use of OMA are
- Excitation is uncorrelated with respect to the system modes
- The system is linear
- Modes can be separated, i.e. the modal overlap is 0.3 or less.
- Modes as basis function are meaningful. To exemplify, for conditions where (outdoor) free waves propagate, the use of standing (non-propagating) waves (=modes) would be a poor choice.
- A correct and physically meaningful mode set was identified in the OMA.
An example of a OMA is supplied here:Link
Other types of system analyses are Principal Components Analysis (PCA) that can be used to identify component contributions. PCA usually is based on Singular Value Decomposition.
PCA is part of Transfer Path Analysis where the objective is to identify the contribution from various sources to noise and vibration, e.g. in a vehicle.


