Vibration Isolation
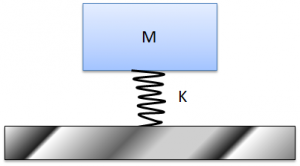
 Vibration isolation often is assumed to be a component property, i.e. something exclusively related to the isolating spring component or the resonance frequency of the mass-spring system (see Figure 1).
The component property assumption is of importance as it affects how we act and think when dealing with vibration isolation. Believing that vibration isolation simply is an item to purchase can mislead your engineering process as you overlook a number of things that affect the end result.
Note – We assume that the reader understands the sdof system shown in Figure 1. If not, read this information about the sdof system before continuing to read this post on vibration isolation.
Figure 1. 1-dof (degree of freedom) Mass-Spring system with a resonance frequency of 2πf = √(K/M), where mass is M (kg), stiffness is K (N/m) and frequency is f (Hz). Note that the grey floor is infinitely rigid, that there is no deformation within the Mass (M) and that the spring has zero weight in the 1-dof model.
In fact, most design practice assumes that vibration isolation is a component property and in doing so silently assumes that:
- The machine to be isolated is infinitely rigid.
- The floor is infinitely rigid.
There are two ways to define isolation:
- Transmission Loss (TL) – where vibration above and below the isolator is compared as TL = 20 Log10(Vabove/Vbelow) dB.
- Insertion Loss (IL) – where vibration at one or several defining response positions before and after the isolator is applied is compared as
IL = 20 Log10(Vbefore/Vafter) dB.
The easier value to measure is TL as above/below the isolator is readily available. The truer performance value of the two is Insertion Loss.
When making a design from scratch, the cases to compare are rigidly mounted (before) and isolated (after). When making a design modification, the old design (before) is compared with the new design (after).
There are situations where the TL can be very large and the IL is zero dB. To exemplify one such situation, imagine the case of an infinitely stiff floor, where the floor response is zero. The IL cannot be calculated for this situation, as it requires deciding what is 0/0; however, we can imagine a case where the floor is is almost infinitely stiff and the base response is determined by very low background values. In this situation, we can design a system with a tremendous TL value of 80 dB or higher, while receiving an IL value of zero dB (i.e. Vbefore/Vafter = 1). That said, in most situations, IL and TL produce values that land in the same ballpark.
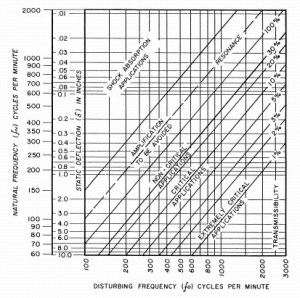
Using sdof theory, a design nomogram stating the degree of TL isolation can then be derived and shown, as seen in Figure 2. We note that we can get any isolation value if we simply move to high frequency. In fact, there is no limit, if the nomogram is to be believed.
Figure 2. Isolation nomogram for the 1-dof mass-spring system. (Click figure to enlarge)
For most real-life systems, the above assumptions are incorrect. Vibration isolation is a system property and machines/floors are anything but infinitely stiff. If we want to be picky, isolator springs do not act as perfect springs at high frequency. Ignoring these observations often leads to a poor vibration isolation performance.
Why the above assumptions are wrong can be exemplified by a simplistic example:
Imagine three springs connected in a series. One spring is 1000 times weaker than the two other springs. In applying a load at the top of the three springs, where do you expect most of the deflection to take place?
Of course it will be the weak spring that does most of the deflection – after all, it is 1000 times weaker than the other two springs.
If the weak spring is the middle spring, we can state that we isolate the top system from the bottom system, as motion from the top is not transferred to the bottom when the middle spring does all the flexing.
However, if the weak spring is the top or the bottom spring, isolation simply does not take place, as the flexing then occurs in the top or bottom springs.
At this point, some readers may object that a machine or a floor is not a spring – which is absolutely true. We now need to enter the concept of dynamic stiffness (add link here), which is stiffness that varies with frequency.
Dynamic stiffness is low at resonance and high at anti-resonance frequencies, respectively. For many built-up mechanical systems, the dynamic stiffness magnitude drops from static stiffness to a magnitude at resonance about 100 times lower than is its static stiffness (see Figures 3 and 4). At anti-resonance, dynamic stiffness can be 100 times larger than static stiffness.
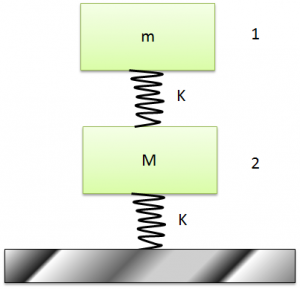
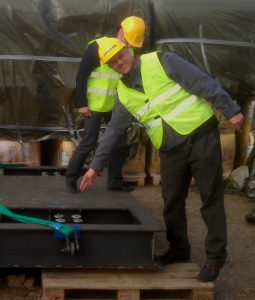
Figure 3. A 2-dof system comprised of a top weight of 1 ton and a bottom weight of 100 tons, supported by springs of stiffness 1E9 N/m.
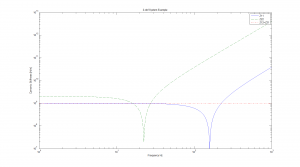 Figure 4. Dynamic stiffness, Z11, Z12 and Z21, as a function of frequency for the 2-dof system of Figure 2. At low frequency (0 Hz), we find that the dynamic stiffness, as expected, matches the static stiffness 1E9 N/m and 2E9 N/m, respectively. The dynamic stiffness, Z11 and Z22, dips at resonance to a value controlled by system damping. Above resonance, the dynamic stiffness, Z11 and Z22, grows with frequency as the masses become inert (hard to oscillate). The transfer stiffness, Z21, remains constant, as expected. (Click figure to enlarge)
Based on the concept of dynamic stiffness, we now realise that a structure can be very stiff at one frequency and very weak at another frequency. This insight implies that the machine and/or the floor side of the vibration-isolating interface can be either stiff or weak, depending on the frequency we examine.
Vibration isolation therefore depends on the how stiff the weakest machine/floor component is in comparison with the isolator spring stiffness.
For high-performance vibration isolation, the isolator must remain the weakest component throughout the relevant frequency range. A high-performance vibration isolation example is shown in Figure 5.
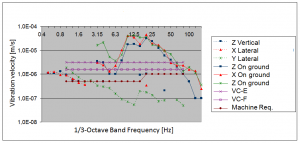
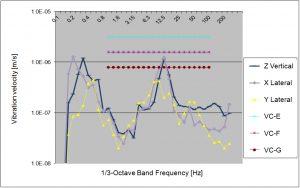
Figure 5. The higher values show vibration on the ground. The lower values show vibration on the isolated side. Data points that are not shown were deleted, as the response was below the transducer’s internal noise threshold. Some criteria and machine environment specifications for maximum performance are also plotted. (Click figure to enlarge)
Next, we need to clarify and define two physical mechanisms. Damping is often confused with isolation. Isolation is a very different process from damping (link), as damping involves the destruction of vibration energy into heat, while isolation implies the containment of vibration energy on one side of an isolating interface.
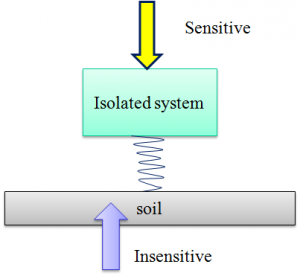
In isolating a machine from exterior influence, typically from the floor or soil, we arrive at a dilemma. The machine is damped when connected to the soil, as vibration generated from the machine can be transmitted into the soil and then destroyed into heat. Isolating the machine removes this damping mechanism and the system becomes easier to excite on the isolated side. Therefore, a vibration-isolated machine may well become very sensitive to excitation from its internal sources (See Figure 6).
Excitation on the vibration-isolated side may have to be limited to a force around milliNewton (~1E-3 N) for the vibration isolation of nanoresolution (~1E-9 m) scientific machines. There are ways to address the situation, but high-performance vibration isolation must take machine internal excitation into account.
Figure 6. A dilemma; a highly vibration isolated machine becomes very sensitive to internal sources.
Figure 7. An example of a highly vibration isolated machine that is operated with very low background vibration in the soil. As can be seen at 12.5 Hz – 16 Hz, the machine contains an internal source that increases vibration by an order of magnitude. For this particular example, this did not interfere with machine performance and the situation could be left as-is. For fun, we can observe that 1E-6 m/s at 0.2 Hz -0.4 Hz implies a vibration amplitude of 0.8 μm – 0.4 μm and that 1E-6 m/s at 12.5 Hz implies a vibration amplitude of 13 nm. (Click figure to enlarge)


