

Finite Element Analysis of Sound Transmission Through Pipes

Qring uses Code Aster (CA) as its FE code (Link). The development version of CA is freeware. CA is a very competent FE code for the analysis of vibration, stress, fatigue, acoustics and pulsation.
Below is a small example of sound transmission through pipe sections. The analysis results from these generic models were used to support analysis and decision-making for acoustics at plant level.
This example is of interest as a way to use Finite Element Analysis, which can be used only for limited segments of a system, to assess data for several kilometers of piping.
The analysis is made as follows:
- A plane acoustic wave is used as a sound source. This wave source creates vibration in the FE model of the pipe structure.
- Pipe inside ends are anechoic.
- The inside pipe and acoustic sections are coupled along the entire model length.
- A small section of the pipe (shown in red in the figures) is coupled to an anechoic acoustic external section. The vibration of the pipe shell is allowed to radiate to the exterior on the red coupling surface and the net radiated acoustic sound power is calculated on the sphere’s surface.
- Data is thereafter assessed per unit pipe length such that it can be scaled for plant-wide use.
This is what an analysis model looks like for a straight pipe, a pipe vend and a tee, respectively (see Figure 1).

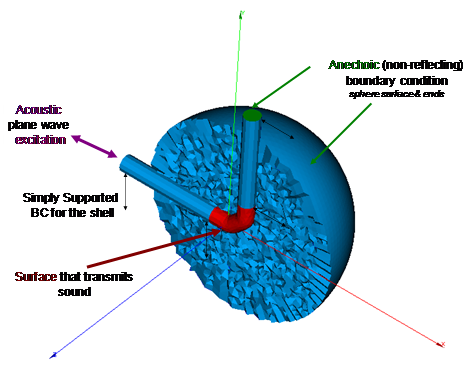

Figure 1. Vibroacoustic simulation models for piping vibration and radiated sound analysis for straight, bend and Tee pipe segments. The pipes are made from GRP. (Click figure to expand)
The model computes Sound Pressure Levels (SPL) inside the pipe and in the far field. A transfer function can be derived from this data as well. The results look like this (see Figure 2):
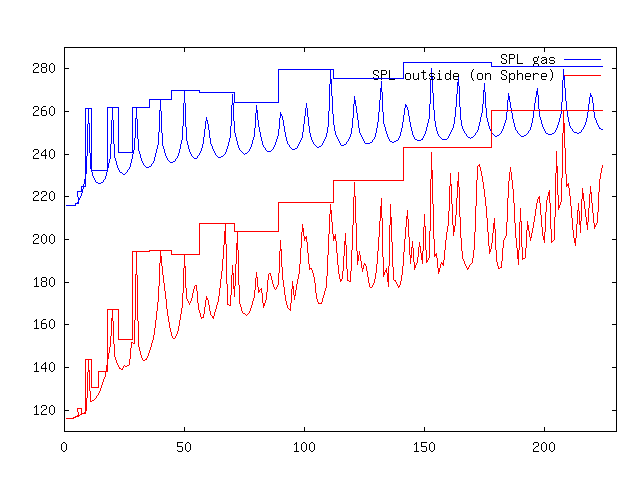
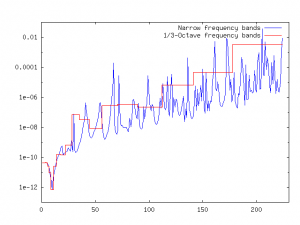
Figure 2. Top figure. Computed SPL inside the pipe and outside the pipe in the acoustic far field. Bottom figure. Sound reduction index for transmission through the pipe wall. (Click figure to expand)
Peak transmission is readily identifiable in these curves and can be backtracked to pipe vibration. An example is shown here, where the pipe cross section ovalises and thereby transmits more sound. The grey shape in front is the pipe structure vibration and the coloured section is sound pressure from both inside the pipe and outside the pipe in the anechoic environment (see Figure 3).
Figure 3. Example of detailed analysis at a frequency where the pipe transmits sound and pulsation drives pipe wall vibration. In this case, we find the pipe cross section to bend into a so called ovalisation mode. (Click figure to expand)